
Usage
Step 1 — Create ROI (QuPath)
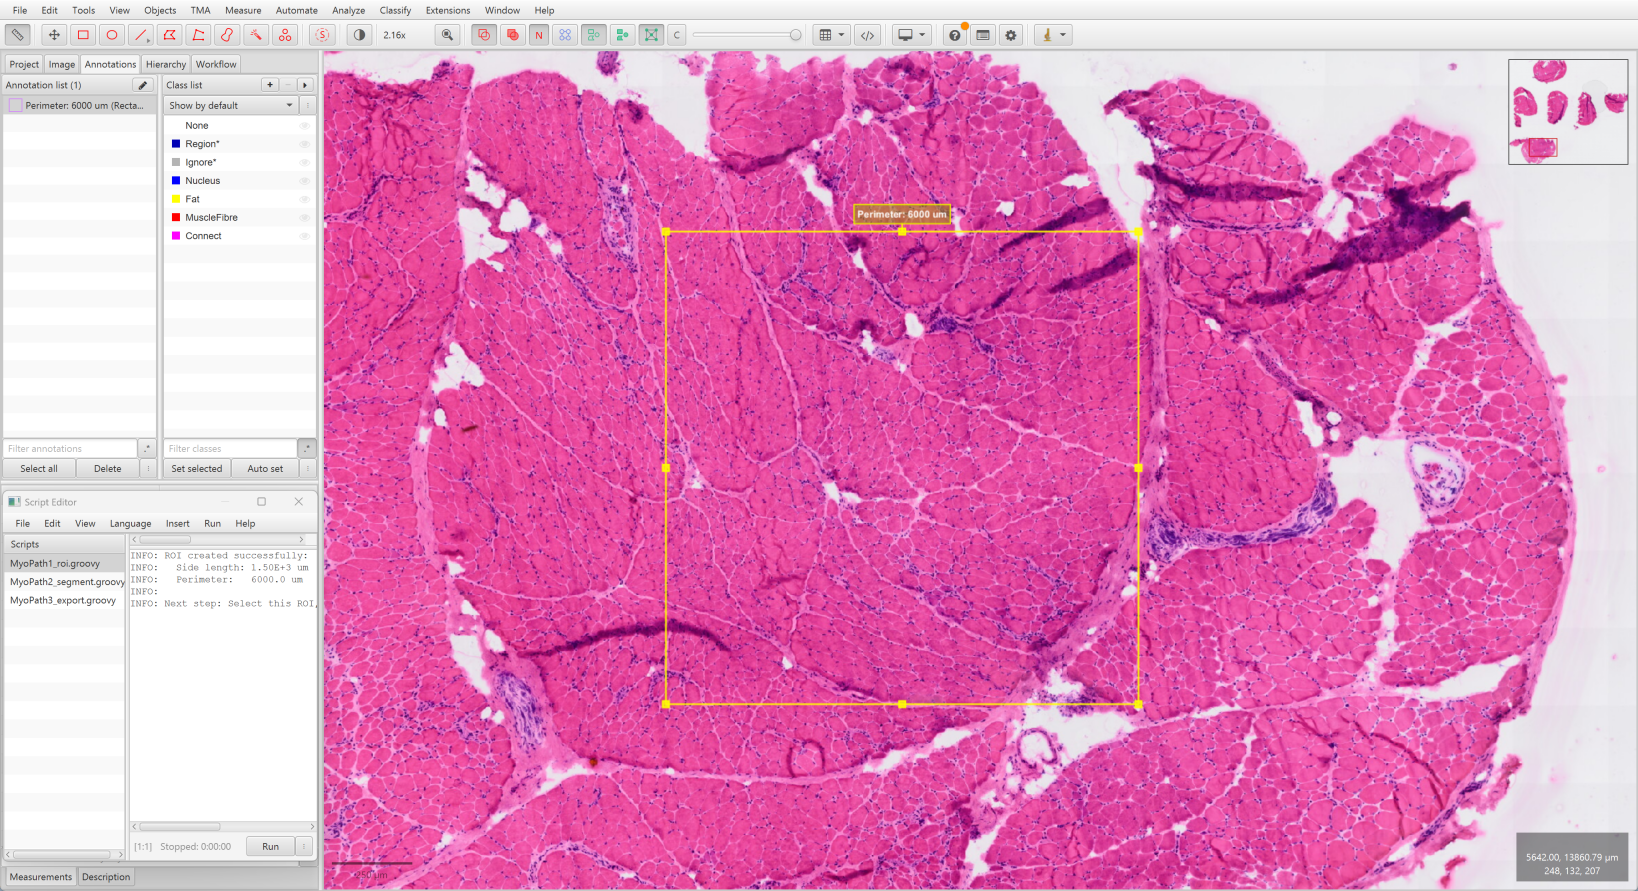
- Open your
.vsislide in QuPath - Navigate to the region of interest
- Run
MyoPath1_roi.groovyin QuPath Script Editor (Automate → Show script editor) - A 1500 µm × 1500 µm square ROI appears centered on your view
TIP
The ROI size is standardized to ensure consistent tissue sampling across slides.
Step 2 — Segment Tissues (QuPath)
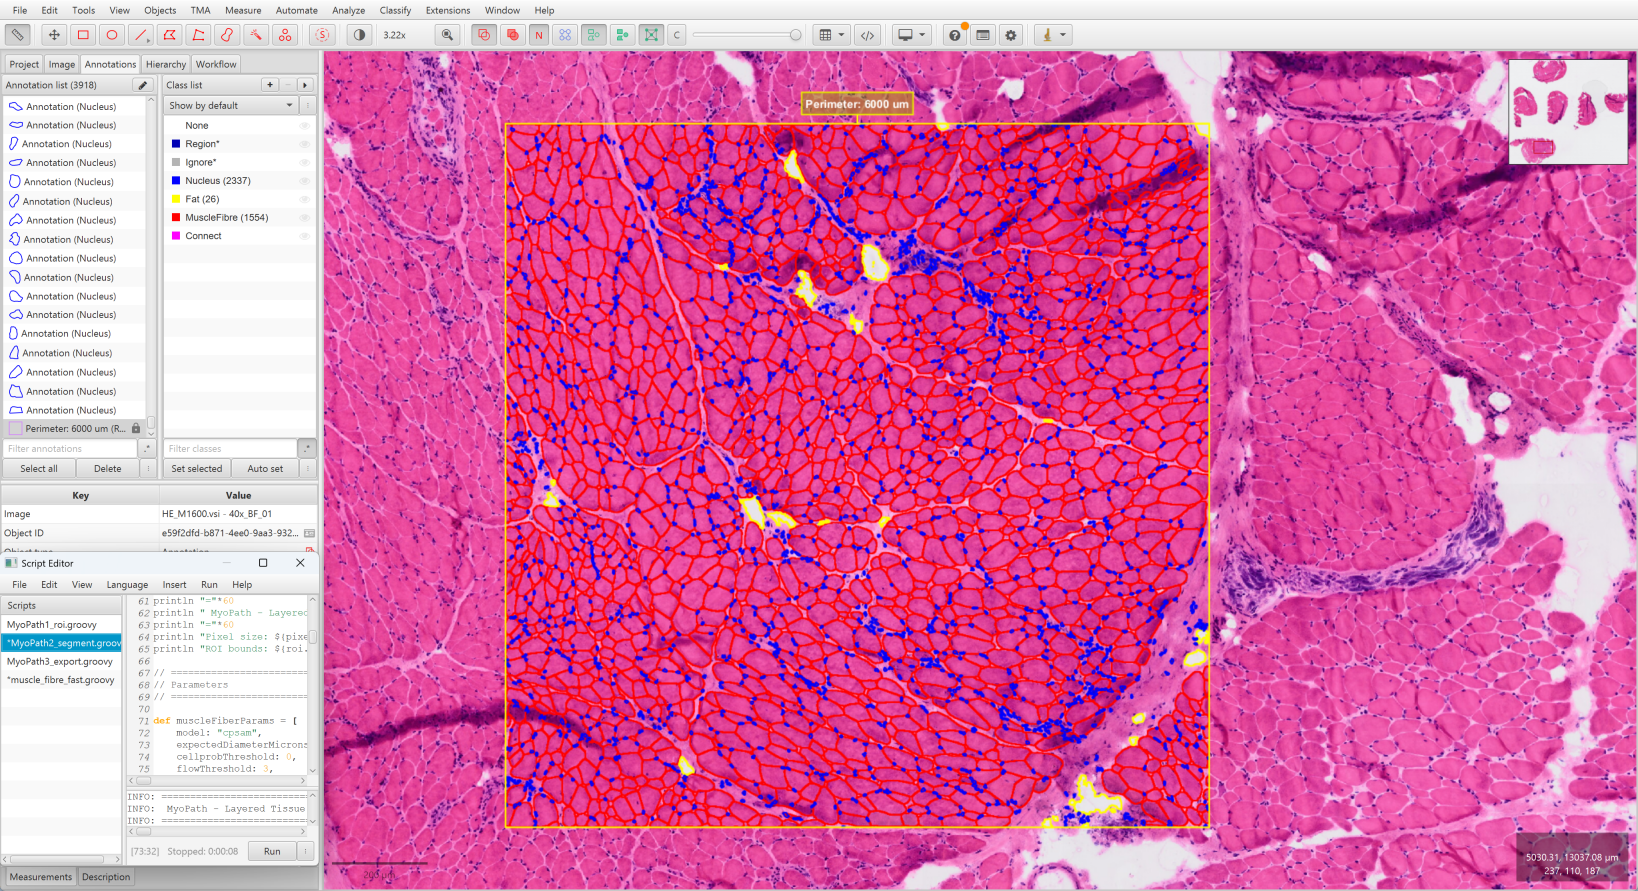
- Select the ROI created in Step 1 (click on it)
- Run
MyoPath2_segment.groovy - Wait for three-layer segmentation to complete:
- Muscle fibers via Cellpose-SAM (~30–60 s with GPU)
- Fat regions via pixel classifier (~5 s)
- Nuclei via watershed (~10 s)
- All annotations appear as independent objects with color coding:
| Color | Tissue |
|---|---|
| Red | Muscle Fiber |
| Yellow | Fat |
| Blue | Nucleus |
Key Parameters
The script exposes several parameters that can be tuned for your tissue:
Muscle fiber segmentation (muscleFiberParams):
| Parameter | Default | Description |
|---|---|---|
expectedDiameterMicrons | 80 | Expected myofiber diameter in µm. If fibers are consistently missed or over-merged, adjust this to match the typical fiber caliber in your samples |
downsample | 10.0 | Controls segmentation resolution. Lower values give finer detail but increase memory usage and processing time; higher values are faster but coarser |
Fat detection (fatParams):
| Parameter | Default | Description |
|---|---|---|
splitThreshold | 0.1 | Threshold for splitting fat regions from the pixel classifier. The default works with the provided Fat in muscle classifier; if you train your own classifier in QuPath, you may need to adjust this value |
Nucleus detection (nucleusParams):
| Parameter | Default | Description |
|---|---|---|
threshold | — | Detection threshold on the Hematoxylin channel signal intensity. Increase to detect fewer (higher-confidence) nuclei; decrease to detect more (at the risk of false positives). Optimal value depends on staining intensity |
WARNING
The fourth tissue layer — connective tissue — is computed by Boolean subtraction in Step 4, not annotated directly in QuPath.
Step 3 — Export Data (QuPath)
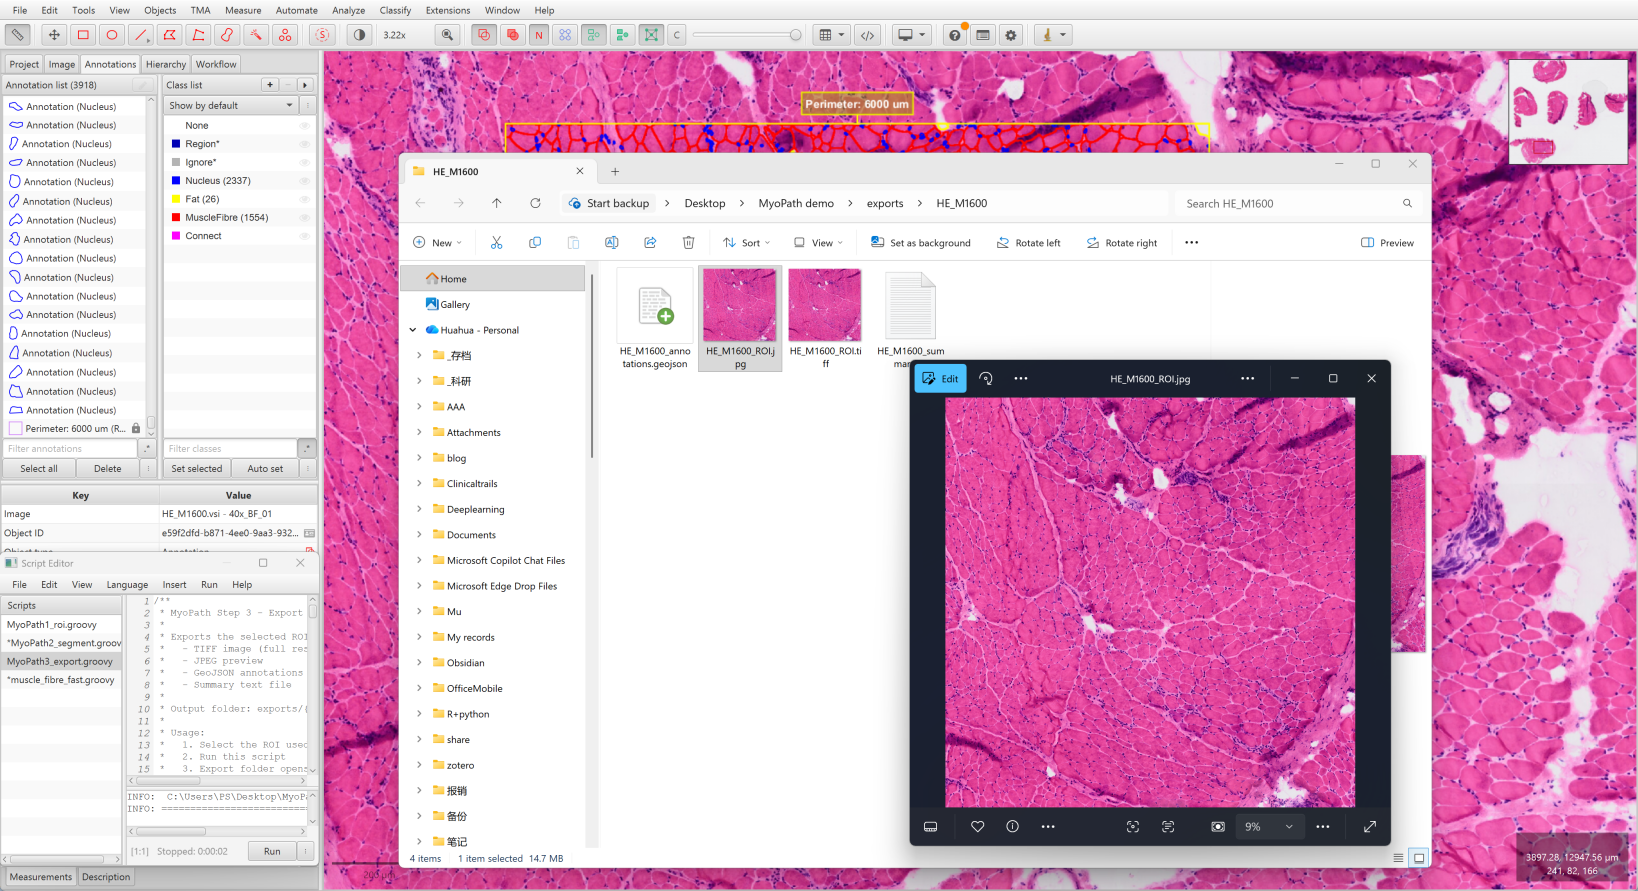
- Select the ROI again
- Run
MyoPath3_export.groovy - Output saved to
exports/{image_name}/:
exports/HE_M3669/
├── HE_M3669_ROI.tiff             # Full-resolution ROI image
├── HE_M3669_ROI.jpg              # JPEG preview
├── HE_M3669_annotations.geojson  # All annotations
└── HE_M3669_summary.txt # Export summaryStep 4 — Batch Analysis (Python)
bash
cd MyoPath

# Test with a single sample
python MyoPath4_analysis.py --test HE_M3669

# Process all samples
python MyoPath4_analysis.py --all --cores 16

# Process specific samples
python MyoPath4_analysis.py --samples HE_M1600,HE_M2806

# Custom input/output directories
python MyoPath4_analysis.py --all --input /data/exports --output /data/results

# Debug mode (single process)
python MyoPath4_analysis.py --test HE_M3669 --sequential --verboseCLI Options
| Flag | Default | Description |
|---|---|---|
--test NAME | — | Test a single sample |
--samples A,B | — | Process specific samples (comma-separated) |
--all | — | Process all samples in exports/ |
--input DIR | ../exports | Exports directory path |
--output DIR | ../results | Results directory path |
--cores N | 10 | CPU cores for parallel processing |
--sequential | off | Single-process mode (for debugging) |
--verbose | off | Detailed logging |
Output Structure
Each processed sample produces per-sample results in the exports directory, plus aggregated results:
exports/{sample_name}/                    # Per-sample results
├── {sample}_statistics.json             # Tissue area statistics
├── {sample}_dystrophy_report.json       # Full pathology report
├── original_image.png                   # H&E image
├── standard_segmentation.png            # 4-tissue overlay
├── muscle_fiber_colormap.png            # Individual fiber colors
└── three_view_comparison.png            # Side-by-side comparison

results/                                  # Aggregated results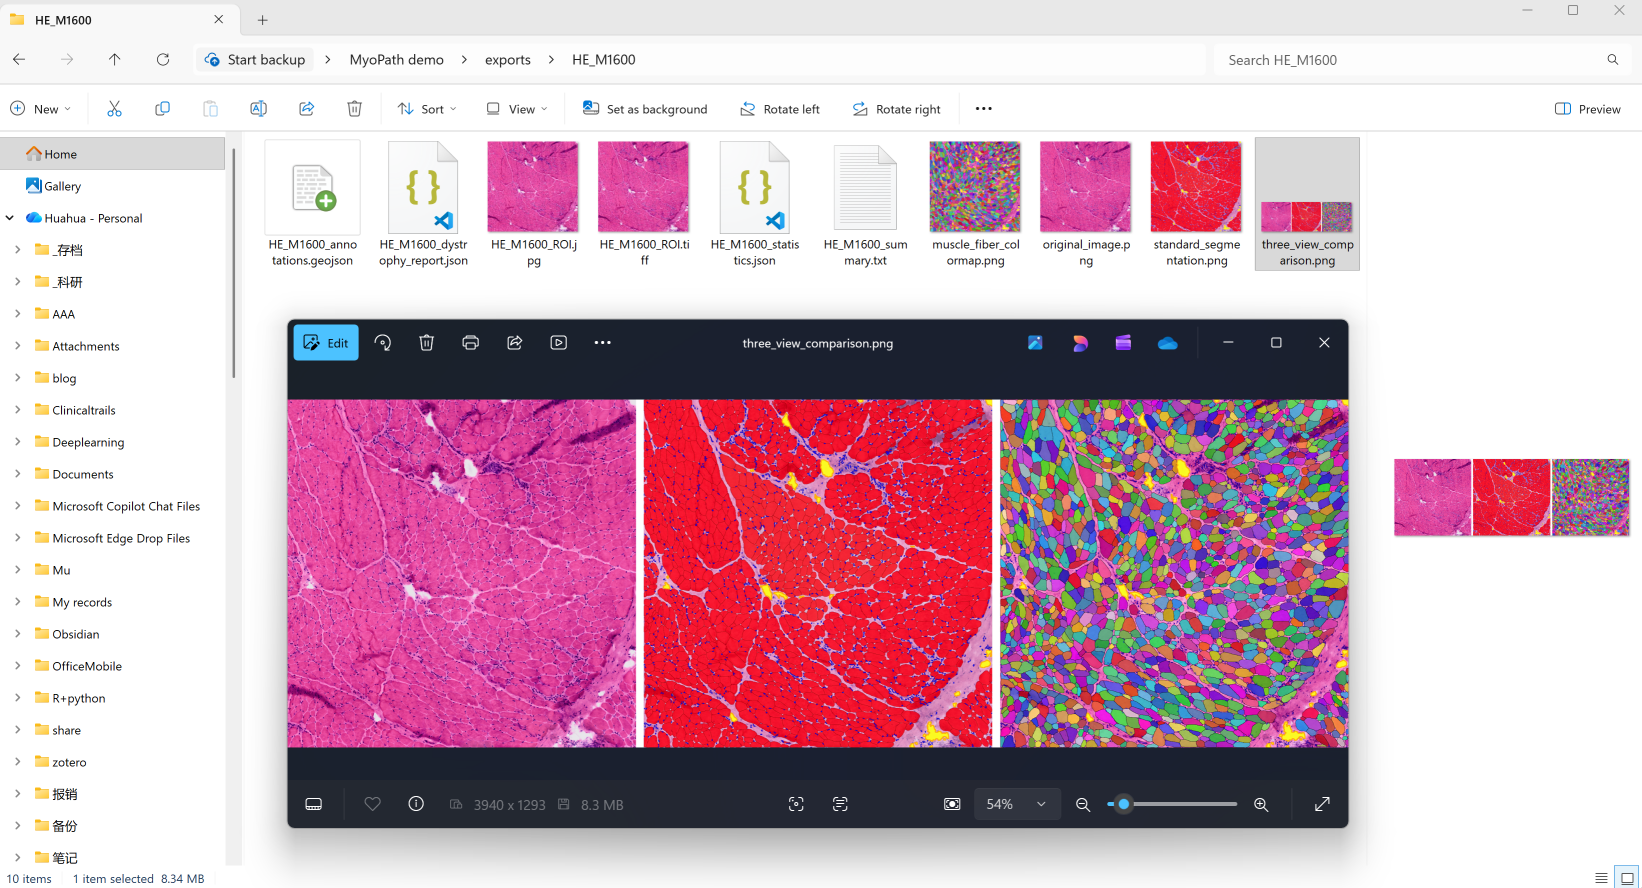
└── batch_analysis_summary.json # Batch processing summaryVisualization Outputs
| File | Description |
|---|---|
original_image.png | Raw H&E-stained tissue image |
standard_segmentation.png | Color-coded overlay of all four tissue types |
muscle_fiber_colormap.png | Each myofiber rendered in a unique color for instance-level inspection |
three_view_comparison.png | Side-by-side panel: original, segmentation, and fiber colormap |
Dystrophy Report
The JSON report (*_dystrophy_report.json) includes all 7 pathology indicators and an overall MyoPath Score (0–100):
| Score Range | Severity |
|---|---|
| 0–20 | Normal / Minimal |
| 20–40 | Mild |
| 40–60 | Moderate |
| 60–100 | Severe |
See Morphometric Features for detailed definitions of each indicator and their clinical interpretation.